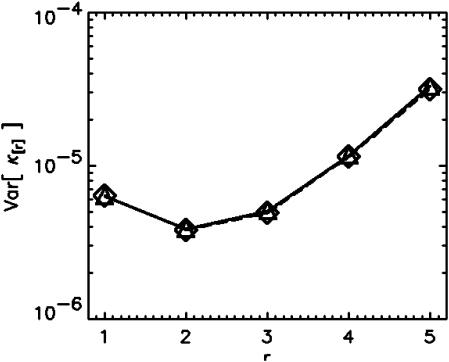
FIGURE 3.
Error analysis of factorial cumulants. A rhodamine 110 sample was measured for 80 s and subsequently divided into 500 records of equal size. The sampling variance (▵) of the factorial cumulants was determined from the statistics of the 500 records. In addition, the variance was determined from theory based on the data of a single record (⋄). Both theoretical and experimental determination of the variance of the factorial cumulants give the same result.

