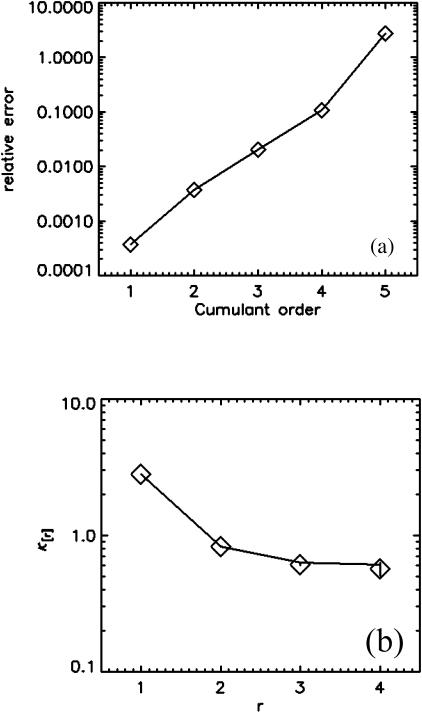
FIGURE 4.
FCA analysis of a rhodamine 110 sample. (a) The relative error σr of the experimental factorial cumulants κ[r] up to order r = 5. The first four cumulants are statistically significant (σr < 1). (b) The experimental cumulants (⋄) are plotted together with an error bar (±σ) for each data point. A fit of the data to a single-species model (solid line) leads to a good description of the experimental histogram. The reduced χ2 of the fit is 1.4, and the fit parameters are ɛ = 3.88 and N = 0.73.

