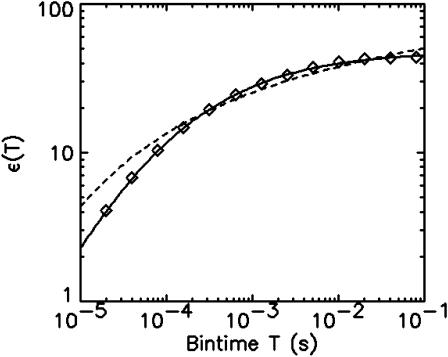
FIGURE 7.
Binning of cumulants. Data of a rhodamine sample are successively rebinned by factors of two. The function ɛ(T) (⋄) is calculated from the first two rebinned factorial cumulants (Eq. 27). A fit of the function ɛ assuming a two-dimensional Gaussian beam profile cannot reproduce the experimental data (dashed line). A fit to a model with a three-dimensional Gaussian beam profile describes the data within experimental error (solid line).

