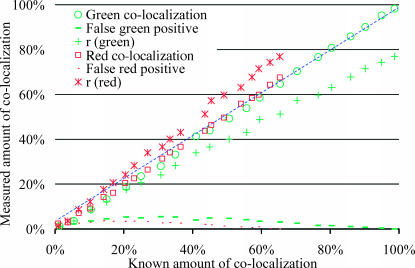
FIGURE 2.
In this simulation pixel-sized objects were generated with random positions and colocalized pixels had identical nonzero intensities in both colors. The intensity distribution of all pixels was uniform with a range 100–255 in both channels. A test series of 100 three-dimensional images (30 × 30 × 30) was generated with different fractions of colocalization by controlling the percentage of identical objects in both channels. The choice of the density of each object was set deliberately low and different (i.e., 6% of the area is covered by green objects and 9% by red) to force the amount of red and green colocalization to be different. Simulations covering the full range of possible colocalization were performed, from all green objects colocalized (i.e., 100% and 67% colocalized green and red objects, respectively) to no colocalization. Finally, noise with intensity distributed uniformly between 10 and 30 was added to both channels. The Pearson's correlation coefficient, r, is plotted twice for the same image, once against the real amount of green colocalization (green +) and once against the red amount of colocalization (red *). We can see that r (* or +) evaluates inaccurately either amount of colocalization in comparison to our current algorithm (○ or □). The P-value (not shown) remained above the 95% significance level as long as >1% of the green objects were colocalized. For all test images, measured amounts of colocalization were accurate with <2% deviation, as is observed with most points close to the diagonal of slope 1 (dashed line). Finally, the two dashed curves show the fractions of pixels without colocalization that were incorrectly classified as being colocalized. This was worst for intermediate amount of colocalization, where up to 5% of pixels were misclassified.

