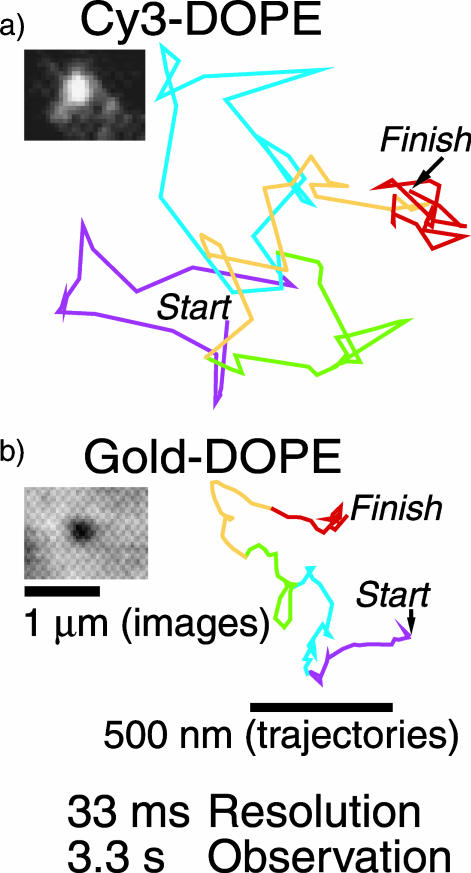
FIGURE 1.
Typical images and trajectories of Cy3- and Gold-DOPE recorded at a 33-ms resolution (video rate) for 3.3 s (100 frames). (a) SFVI of Cy3-DOPE. (b) SPT of Gold-DOPE (gold probes coated with anti-fluorescein antibody Fab fragments bound to fluorescein-DOPE, which was preincorporated in the cell membrane). The colors (purple, blue, green, orange, and red) represent the trajectories over time periods of 20 steps (every 660 ms). The color sequence is consistent throughout this article. The actual video images are also shown.

