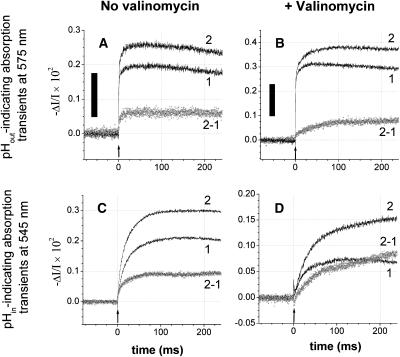
FIGURE 6.
Proton transfer through F0 as monitored by two pH indicators reporting pH transients from either side of the chromatophore membrane, (A, B) from the n-side (Cresol red, 90 μM, at a wavelength of 575 nm), and (C, D) from the p-side (Neutral red, 26 μM plus 0.3% w/v BSA, at 545 nm). Traces in parts A and C were recorded in the absence, and traces B and D in the presence of the ionophore valinomycin (2 μM). In the latter case the transmembrane voltage was collapsed by the valinomycin-mediated K+ current in <3 ms (see Fig. 2). The relaxation of the pH difference was then entirely due to the entropic driving force (ΔpH). The proton release from bc1 was slower in the presence of valinomycin (compare to traces 2 in Figs. 6 C and 5 D). The medium contained 50 mM KCl, 5 mM MgCl2, 2 mM K4[Fe(CN)6], 2 mM KCN, 5 μM dMF; pH was 7.9. Chromatophore stock was in 5 mM MgCl2, 50 mM KCl, 10% sucrose. Traces 1 without, and traces 2 with 3 μM oligomycin added; traces 2-1 = difference trace ± oligomycin. Actinic flashes are marked by arrows; black bars correspond to 0.002 pH units.

