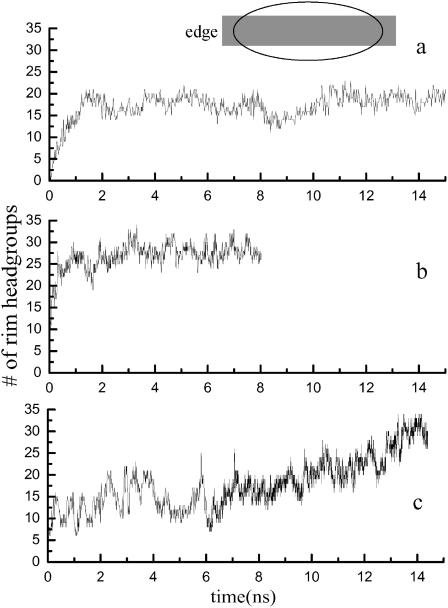
FIGURE 2.
Time course of lipid headgroup migration. Variation in the number of headgroup phosphorus atoms at the bilayer edge, defined as shown in the cartoon as the region from −1.0 nm to 1.0 nm in the x′ direction. (a) Run 2 (from Table 1): DMPC with truncation. (b) Run 3: DMPC with PME. (c) Run 7: POPE.

