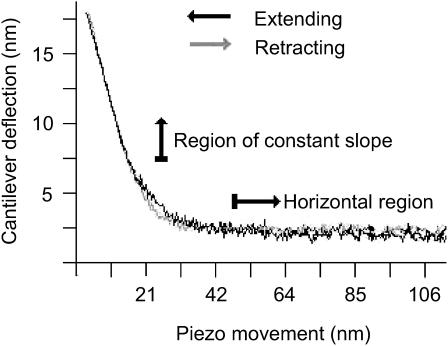
FIGURE 7.
Force distance graph for protein-containing SPB, which displays cantilever deflection (y axis) versus piezo movement (x axis) as the tip approaches the sample (extending, indicated by the black line) and pulls away from the sample (retracting, indicated by the light gray line). The sample in this case is an SPB formed from the stock proteoliposome solution. This graph was chosen for its large repulsion for ease of demonstration. Tip sample repulsion was calculated by observing the amount of cantilever deflection between the horizontal and constant slope regions (10 nm in this graph). Using Hook's law and cantilevers (spring constant 60 pN/nm) one can calculate tip sample repulsion (600 pN in this graph). Imaging solution is 100 mM sodium phosphate buffer (pH 7.4).

