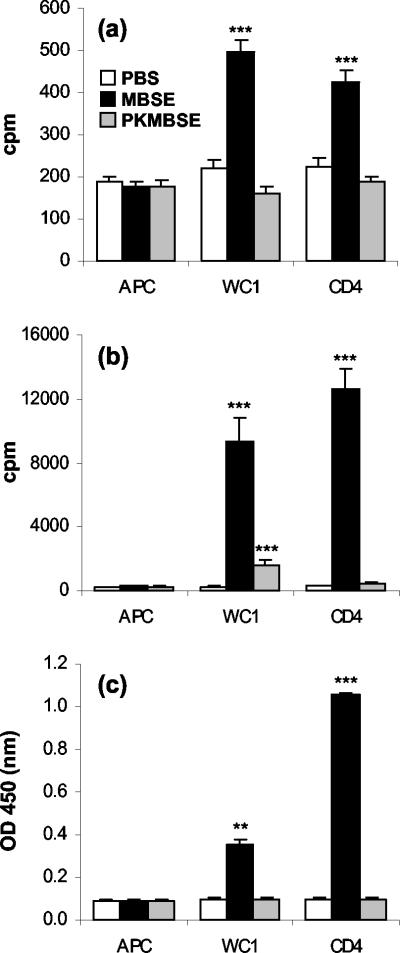
FIG. 1.
Lymphocyte proliferation responses of T-cell subsets from control uninfected animals (a) and proliferation (b) and IFN-γ release (c) by T-cell subsets from M. bovis-infected animals in response to mycobacterial antigen preparations of MBSE and PKMBSE. WC1+ γδ and CD4+ T cells were magnetically (MACS) purified and cultured with antigen in the presence of autologous mitomycin C-treated PBMC as a source of APC. APC alone were included as controls. Lymphocyte proliferation data are presented as cpm. A proliferation response was considered positive if the test antigen cpm value was ≥2 × the PBS control cpm value. IFN-γ ELISA results are expressed as the OD450; an OD value of 2 × the background (PBS) value was considered a positive response. The results presented show the mean group cpm or the mean group OD450 plus the standard error of the mean for six repeated experiments. Statistically significant differences between control PBS-treated and antigen-stimulated cells are indicated as follows: ✽✽✽, P <0.001; ✽✽, P < 0.01.

