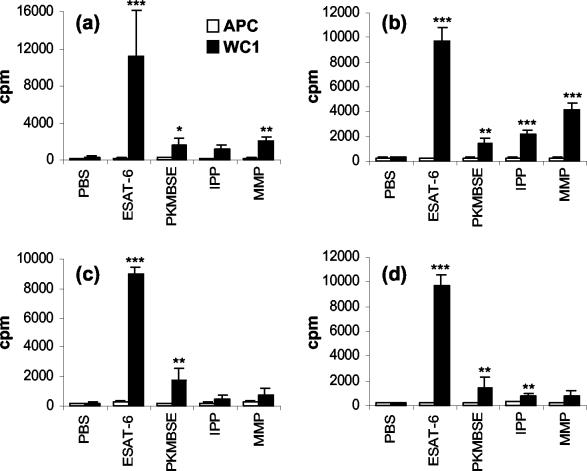
FIG. 2.
WC1+ γδ T-cell proliferation responses of four M. bovis-infected animals to PKMBSE and defined protein and nonprotein mycobacterial antigens in animals 01 (a), 02 (b), 03 (c), and 04 (b). MACS-purified WC1+ γδ T cells were cultured in the presence of autologous mitomycin C-treated PBMC as a source of APC. The results for individual animals are expressed as the cpm or the OD450 (plus the standard error of the mean), as described in Fig. 1. Significant differences between control PBS-treated and antigen-stimulated cells are indicated as follows: ✽✽✽, P <0.001; ✽✽, P <0.01; ✽, P <0.05.

