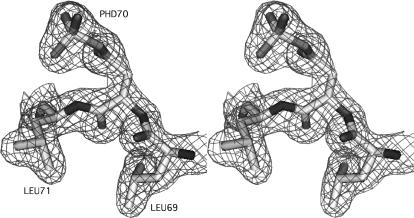
FIGURE 5.
Rendered representation of the active-site aspartate PHD70 with the enclosing electron density contoured at 1 σ (mesh). Atoms are colored according to type: C (light gray), O (gray), N (dark gray). The extra density encountered in the experimental map and issuing from the carboxyl group of PHD70 perfectly accommodates the covalently bound phosphoryl group as shown. The correctness of the model was verified by calculating an omit map of the respective region (not shown).

