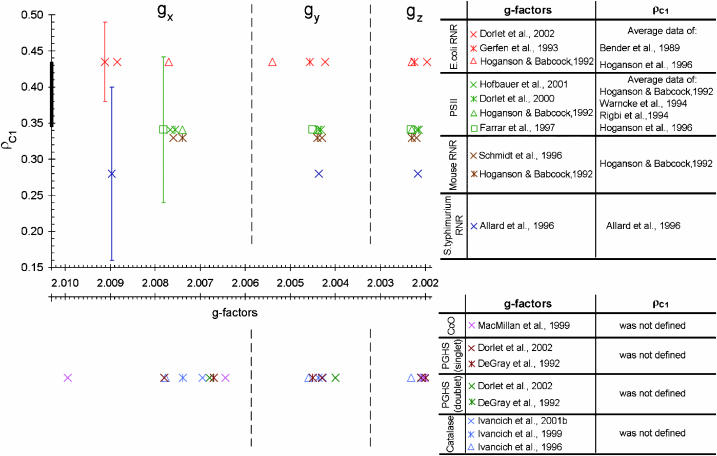
FIGURE 6.
The literature data on the three g-factors and the spin density on the C1 atom in different tyrosyl radicals. The thick segment of the ρC1 axis indicates the size of Fig. 7 if plotted on this scale. The dotted vertical lines approximately indicate the gx, gy, and gz areas. The data quoted can be found tabulated in Supplementary Material, Algorithm description.pdf, Tables S3 and S5.

