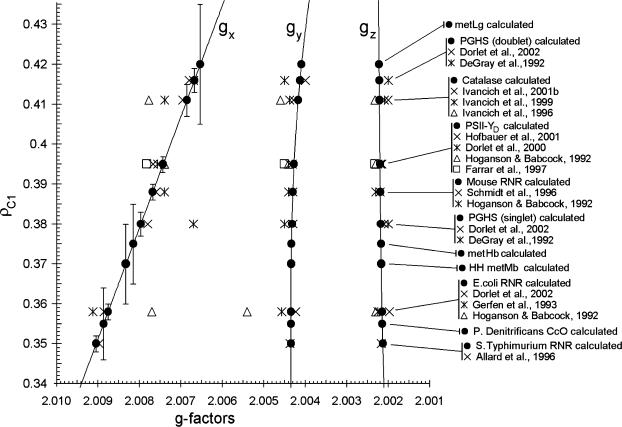
FIGURE 7.
The ρ-g chart for the 11 tyrosyl radicals studied (•). The value of the spin density on atom C1 (ρC1) for each tyrosyl radical was found as the optimal input parameter of the algorithm for the EPR spectrum simulation (Table 1); the principal values of the g-factor were generated by the algorithm. The errors in ρC1 are indicated at the gx components (note significantly higher error for the radicals with unknown HF spectrum). The continuous lines are generated by the algorithm. The literature data on the principal g-factors of the Tyr radicals are also shown with the ρC1-value for each radical formally assumed the same as the value found in this work (compare with Fig. 6).

