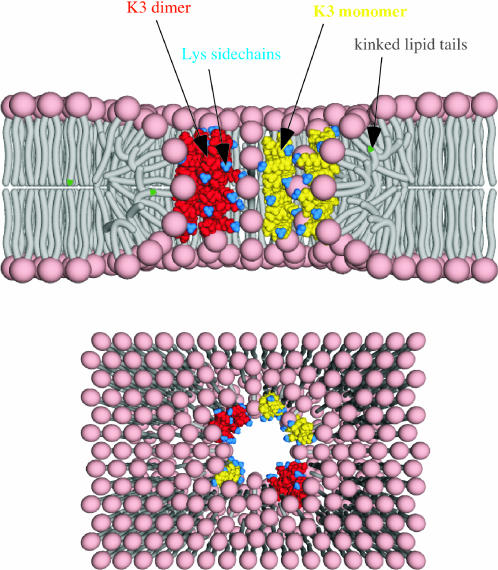
FIGURE 13.
Cartoons of the pore model: cross section (top) and top view (bottom). (KIAGKIA)3-NH2 monomers and dimers are shown in yellow and red, respectively. The lysine side chains are indicated by blue. Peptide chains and lipid headgroups together line the wall of the torus-like pore. A few of the kinked lipid chains have 19F-labeled tails (in green) near the phospholipid headgroups.

