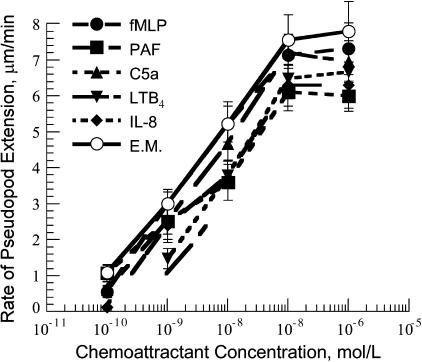
FIGURE 4.
Rate of pseudopod extension verses chemoattractant concentration. The rate of pseudopod extension increased with the increase of the chemoattractant concentration for the range of concentrations from 10−10 to 10−7 M. The rate of pseudopod extension reached saturation above 10−7 M chemoattractant. The • were for fMLP, the ▪ were for PAF, the ▴ were for C5a, the ▾ were for LTB, the ♦ were for IL-8, and the ○ were for the equimolar mixture of all chemoattractants. The shown concentrations were the concentrations in the delivery pipet, and the distance between the leading edge of the pseudopod and the delivery pipet was 1 μm. Therefore, the actual chemoattractant concentrations at the leading edge of the pseudopod should be 30% smaller that the ones shown in the figure. The data points for pseudopod extension were expressed as the mean ± SD of at least 10 cells. The temperature was 25°C.

