FIGURE 3.
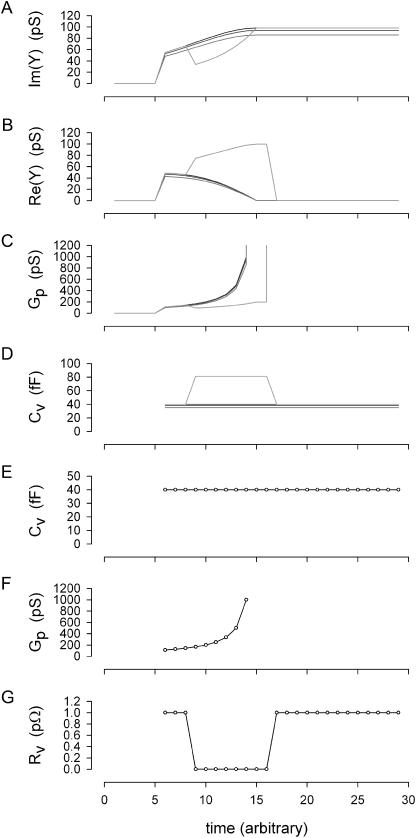
Simulation and analysis of vesicle fusion event. Whole-cell conditions remained constant throughout simulation at Rm: 1 GΩ, and Cm: 6.5 pF, with Rs: 1, 10, and 20 MΩ for dark traces (vesicle resistance, Rv, held constant at 1 pΩ (1e15Ω)). For the shaded trace, Rs was 1 MΩ and vesicle resistance, Rv, was stepped transiently from 1 pΩ to 10 GΩ as shown in panel G. (A, B) Imaginary and real components of admittance determined according to Breckenridge and Almers (1987). (C, D) Vesicle pore conductance and capacitance extracted from admittance using standard methodology (Breckenridge and Almers, 1987; Lollike et al., 1995). Note very good correspondence between components of model even when Rs changes substantially (solid lines in panels E, F), but not when Rv is altered (shaded line). This discrepancy is not unanticipated because the standard methodology sets Rv as infinite (Breckenridge and Almers, 1987; Lollike et al., 1995). (E, F) Vesicle model parameters (solid lines) and estimates made with the eCm method (○). Correspondence is exact under all conditions. At time >5, vesicular fusion was simulated by linearly ramping the fusion pore resistance (Rp; initially infinite) from 9 GΩ (111 pS) to 1 GΩ (1000 pS); the resulting pore conductance is shown in panel F (solid line). Fusion event analysis was implemented at that time.

