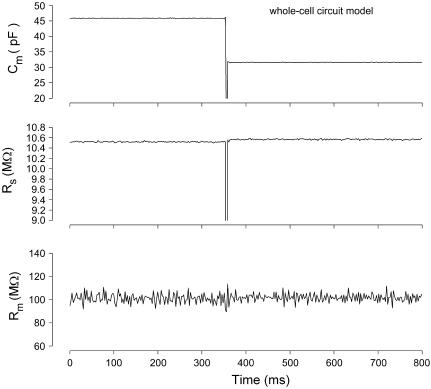
FIGURE 4.
Effects of large Cm changes on parameter estimates with the eCm method. Nominal initial component values of Rs: 10 MΩ, Rm: 100 MΩ, and Cm: 33 pF ‖ 15 pF. A step decrease in capacitance was accomplished by suddenly removing the parallel 15 pF component. The three panels show the calculated values of the parameters using the eCm method at a sampling rate of 2.56 ms. Note large abrupt drop in capacitance (top) with virtually no effect on measures of Rs and Rm (middle and bottom). Model was voltage clamped with a PC clone, Axon 200 amplifier (Union City, CA) in resistive feedback mode (β = 0.1), 10-kHz Bessel filter, and Axon 1322A A/D D/A board.

