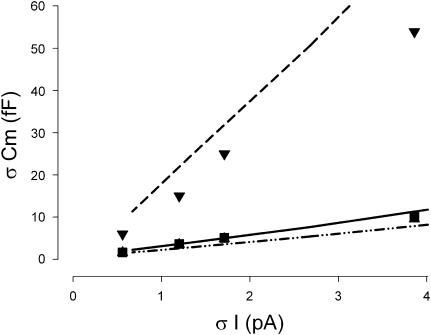
FIGURE 9.
Effect of system noise on Cm estimate noise. Results from either mathematical modeling (lines) or physical modeling (symbols). Three methodologies, step (dashed line, ▾), eCm (dash-dotted line, ▴), and single-sine phase tracking (solid line, ▪) are presented. For the software model, forced Gaussian noise levels were imposed, and the noise of Cm estimates calculated. For the physical model, system noise levels were 3.8 pA rms when the model was attached to the headstage. To obtain lower system noise levels, averaging was performed to produce the plotted noise levels. For the electrical model, a 10-kHz Bessel filter was used, and the frequency components of the remaining noise were likely different from the wideband noise used for the math model. This likely accounts for differences in math and electrical model results. In any case, the data from each model indicate that as system noise decreases, all of the methods become comparable. Nominal component values of Rs: 10 MΩ, Rm: 300 MΩ, and Cm: 18 pF. IBM T40 laptop in battery mode (Armonk, NY), Axon 200 amplifier in capacitive feedback mode, 10-kHz Bessel filter, and Quatech (Hudson, OH) DAQP 308 PCMCIA PC card A/D D/A board were used.

