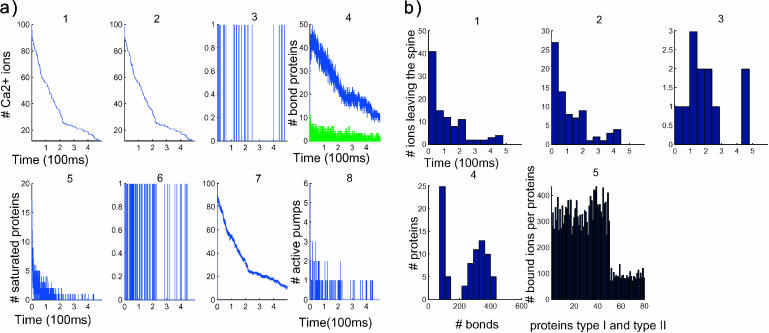
FIGURE 3.
Dynamics of 100 calcium ions in dendritic spine. (a) Time evolution of the concentration and binding. (First row) Concentration versus time (in μs). (Left to right) 1, [Ca2+] in the total spine. 2, [Ca2+] in spine head. 3, Number of ions in the neck. Note that the neck contains only one ion at a time. 4, Number of bound proteins (type 1, blue; type 2, green. Note the stochastic nature of those curves. (Second row, left to right) 5, Number of saturated proteins of type 1 versus time. 6, Arrival times of ions at active pumps: the ions leave one at a time. 7, Number of bound ions versus time. 8, Number of active pumps versus time. (b) Statistical analysis after 100 ions have crossed to the dendrite. (First row, left to right) 1, Calcium efflux from the spine versus time (in μs). 2, Calcium efflux through pumps versus time. 3, Calcium influx into the dendrite versus time. (Second row, left to right) 4, Number of proteins that have bound a given number of ions: only five proteins bound 400 ions during the entire time course of the simulation. 5, The abscissa represents the numbered proteins: 1–50 are the proteins of type 1, 51–80 are type 2. The ordinate represents the number of calcium ions that each protein bound in the simulation.

