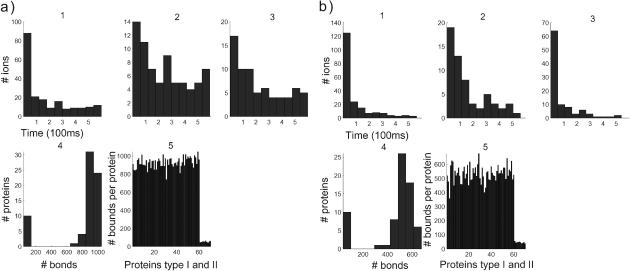
FIGURE 5.
Comparison of the time evolution for postsynaptic distribution of proteins (a) with push and (b) without. (Panels a and b, left to right, first row) 1, Calcium efflux from the spine versus time (in μs). 2, Calcium efflux through pumps versus time. 3, Calcium influx into the dendrite versus time. (Second row, left to right) 4, Number of proteins that have bound a given number of ions. 5, The abscissa represents the numbered proteins: 1–60 are the proteins of type 1, 61–80 are type 2. The ordinate represents the number of calcium ions that each protein bound in the simulation.

