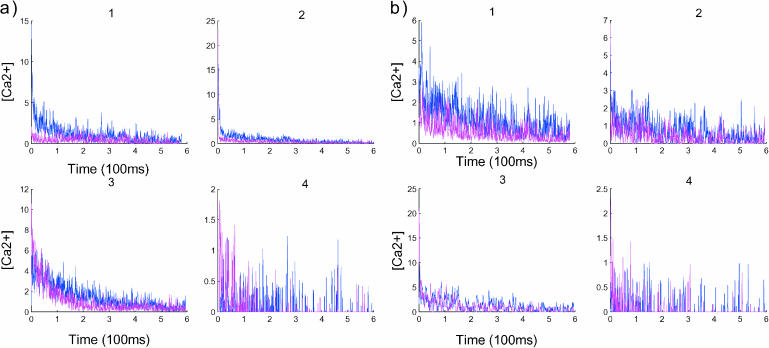
FIGURE 7.
Compartmentalization analysis in a spine divided into four compartments. For each graph, the blue curves represent the result with push and the curves in red without push. Panel a shows the dynamics when the proteins are UD, whereas in b, the dynamics are related to PSD. The data are smoothed out by averaging the number of ions in each compartment: for the quantity X(t), we plot  The y axis of the graphs represents the concentration in each compartment. The compartments are defined in Fig. 1.

