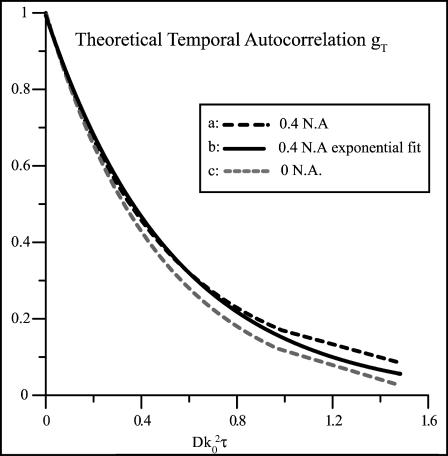
FIGURE 2.
Theoretical temporal autocorrelation function of the scattered light intensity versus unitless time parameter  as calculated from Eq. 43. Three curves are plotted. (a) The black dashed line curve is obtained from a numerical integration of Eq. 43 for a 0.4-NA objective. (b) The black solid curve is a single exponential decay, fit to the points obtained from the numerical integration. (c) The shaded dashed line is the pure exponential decay obtained from the zero aperture limit.

