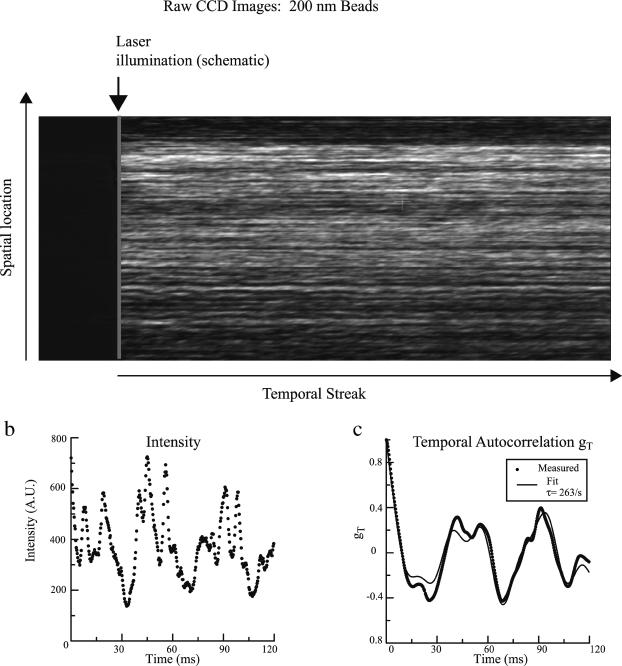
FIGURE 3.
(a) Example of an image recorded from the CCD camera from a 200-nm polystyrene bead suspension. The image is recorded from a single stage position on the sample. The vertical column corresponds to spatial positions on the sample illuminated by the thin line. Each horizontal row is the temporal streak recorded during the readout process of the CCD camera at this location. (b) An example of a recorded intensity fluctuation along one of the rows. (c) The autocorrelation function of the intensity time course shown in b, based directly on the experimental intensities (dotted line) and then subsequently fit with the form of TH Eq. 43 (solid line).

