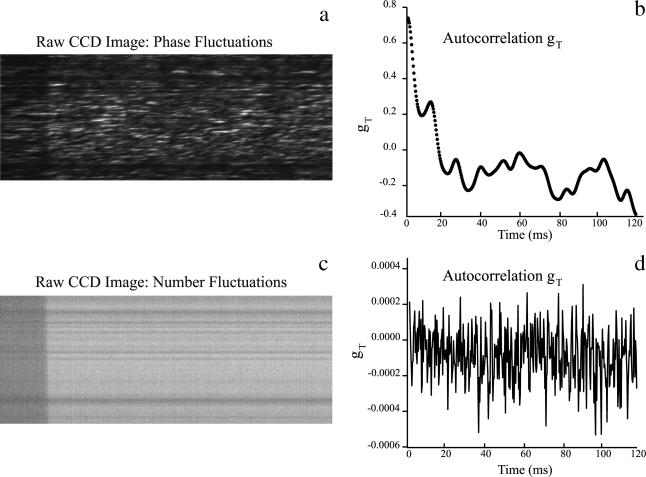
FIGURE 7.
CCD camera images and their corresponding autocorrelation functions of intensity fluctuations from 200-nm carboxylate-modified dark red FluoSpheres. (a) Raw streak image from dynamic light scattering measurement. (b) Normalized temporal autocorrelation function for a, calculated using TH Eq. 43. The large variations in intensity across the raw image imply a large amplitude in the temporal autocorrelation function. (c) Image from the number fluctuation experiment is taken from the same sample as in a but with a longpass 650-nm filter placed in the emission path. The image is very smooth, indicating small intensity variations. (d) Normalized temporal autocorrelation function for c. The function has a very small amplitude, implying that the contribution from particle number variations to the DLSM intensity fluctuations seen in a and b is very small.

