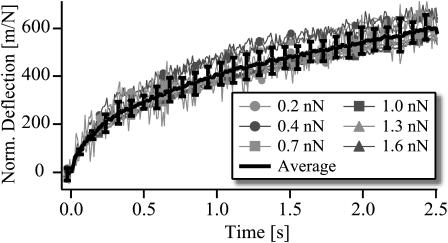
FIGURE 3.
Test of linearity of response by forces between 0.2 nN and 1.6 nN. The response curves are normalized with respect to the acting force amplitude and are thus measures of the surface compliance. All curves were determined by a sequence of constant force pulses acting on the same bead whereas the force amplitude increased between two adjacent pulses.

