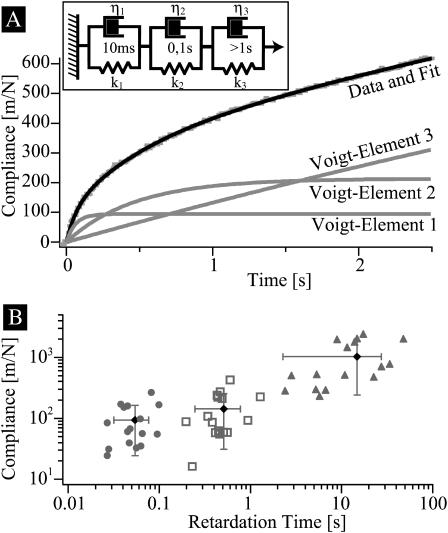
FIGURE 5.
(A) Analysis of viscoelastic response curves in terms of superposition of three Voigt-bodies in series (called TVB-model in the text). (B) Plot of the measured compliances Ji as a function of the retardation times τi. The vertical and horizontal bars indicate the variance of 15 measurements. Note that the width of the variance is smaller than the distances of the average relaxation times.

