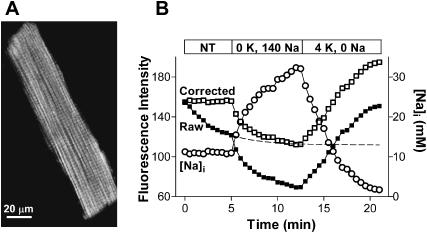
FIGURE 2.
Na-sensitivity of the two-photon SBFI signal. (A) Two-photon fluorescence image of a rat ventricular myocyte loaded with SBFI-AM. (B) Changes in the intensity of the two-photon signal upon Na/K pump inhibition (K-free conditions) and reactivation (0 Na, 4 mM K external solution) (solid squares). To correct for the [Na]i-independent decline in the raw SBFI signal, the points recorded in normal Tyrode's solution were fitted with a monoexponential decay curve (dashed line). The corrected SBFI fluorescence data are indicated by open squares. The corrected signal was then converted into [Na]i (circles).

