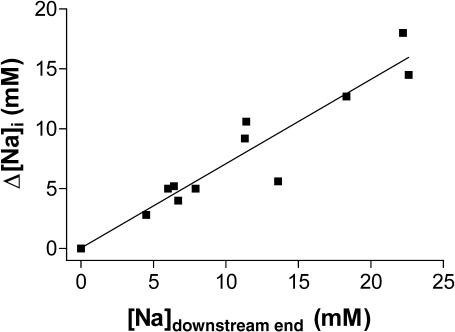
FIGURE 6.
The difference in [Na]i between the downstream and the upstream end of the myocyte as a function of [Na]i near the lower end of the cell. Data were obtained in experiments similar to Fig. 5, in eight myocytes, with different positions of the glass pipette, and thus different fractions of pumps blocked. This is mainly reflected in the rise in [Na]i at the downstream end of the myocyte.

