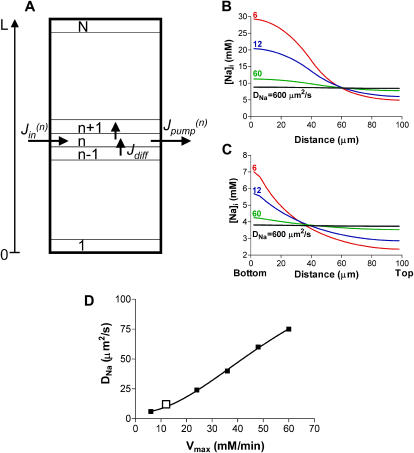
FIGURE 7.
Simulations of [Na]i distribution along the longitudinal axis of the myocyte during local Na/K pump inhibition. (A) Schematic representation of the cell model used for simulations. A cylindrical cell (R = 10 μm, L = 100 μm) was divided into N (25 in most simulations) compartments along the longitudinal axis and we solved the equations system for [Na]i in each compartment. (B and C) The expected longitudinal [Na]i profile at various values for DNa when Na/K pumps are blocked in the first 10 and last two compartments from the lower end of the myocyte, respectively. (D) The DNa that would produce a longitudinal [Na]i profile similar to the trace for DNa = 12 μm2/s in B, for various values of Na/K pump Vmax. Simulations were done for the case where Na/K pumps were blocked in the bottom 10 compartments. The Vmax:DNa pair used for B is indicated by the open square.

