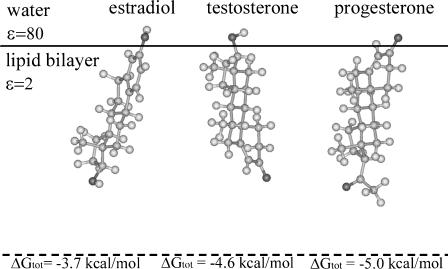
FIGURE 2.
The hormones in their most favorable location and orientation in the membrane slab model. The hormones are represented using a ball-and-stick model, created using InsightII (Accelrys, San Diego, CA). The solid horizontal line marks the boundary between the hydrocarbon region of the membrane, which was assigned a low dielectric constant of ɛ = 2, and the aqueous phase (ɛ = 80). The membrane midplane is shown as a dashed line. The total free energy value associated with each configuration is plotted.

