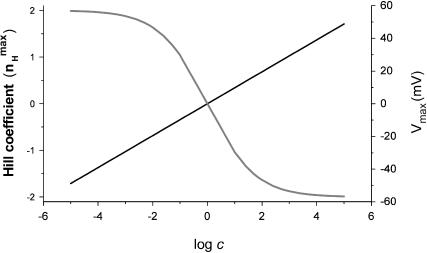
FIGURE 4.
Dependence of the maximal Hill coefficient ( ) and the activation voltage at this slope (Vmax) on c. The graph for
  was plotted based on Eq. 12 (shaded, left y-axis) and that of Vmax (black, right y-axis) according to the equation Vmax = (RT/2ZF)ln(1/(KOKC)), derived by solving the equation ∂nH(V)/∂V = 0, which is a normalized second derivative of the MWC open probability expression. In this plot, for convenience, KC was assigned a value of 1, whereas KO values range from 10−5 to 105. See text for further discussion.

