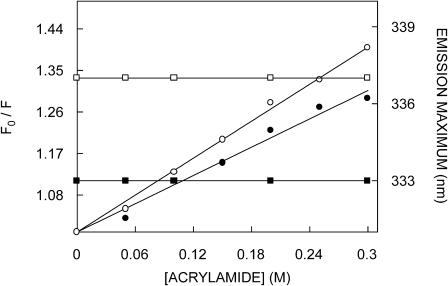
FIGURE 6.
Representative data for Stern-Volmer analysis of acrylamide quenching of gramicidin fluorescence in the nonchannel (○) and channel (•) conformations. F0 is the fluorescence in the absence of quencher, and F is the corrected fluorescence in the presence of quencher. The excitation wavelength was fixed at 295 nm and emission was monitored at 334 nm. The emission maxima of the nonchannel (□) and channel (▪) conformations, when excited at 295 nm, in the presence of increasing concentrations of acrylamide are also shown. Concentration of POPC was 0.11 mM and the ratio of gramicidin to POPC was 1:50 (mol/mol). See Materials and Methods for other details.

