FIGURE 5.
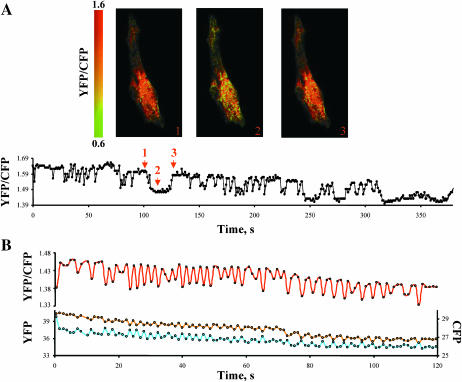
The Ca2+ binding site of the exchanger can sense changes in Ca2+ during excitation-contraction coupling. (A) An example of rat neonatal cardiomyocytes expressing YFP-CBD-CFP and the corresponding changes in YFP/CFP ratio during spontaneous activity of the myocytes. Arrows indicate the time when the images were acquired. Myocytes were kept in Tyrode's solution at room temperature and fluorescence was monitored each second. The vertical bar indicates the YFP/CFP ratio value in pseudocolor. The decrease in the ratio of YFP/CFP correlates with myocyte contraction (not shown). (B) Another example of changes in YFP/CFP ratio during spontaneous contractions of a different neonatal cardiac myocyte. In this case, the contractions were faster. The lower panel shows how the CFP and YFP emissions changed during time. Changes in YFP/CFP values were due to simultaneous and opposite oscillations in CFP and YFP emissions. Images were acquired every second.

