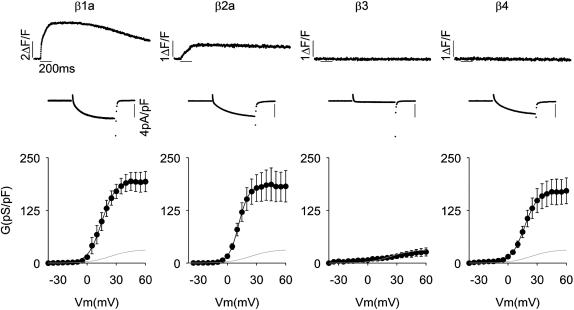
FIGURE 1.
Recovery of Ca2+ current and Ca2+ transients by splice variants of the four β-genes expressed in β1 KO myotubes. Columns show representative β1 KO myotubes transfected with skeletal muscle β1a, cardiac/brain β2a, brain β3, and brain β4. GenBank identification numbers are indicated in Materials and Methods. Top trace corresponds to the spatial integral of the confocal Ca2+ transient in ΔF/F units in response to a 200 ms depolarization to +30 mV from a holding potential of −40 mV. The Ca2+ current during the 200-ms depolarization is shown expanded. Note change in amplitude scale for the time course of fluorescence. Bottom shows Ca2+ conductance versus voltage curves for population averages in response to a 500-ms depolarization in 5 mV increments from −35 to +60 mV. The shaded line in all figures shows the average Ca2+ conductance of nontransfected β1 KO myotubes. Curves were fit with Eq. 1 with the following parameters (Gmax in pS/pF, V1/2 in mV, and k in mV, respectively). For β1a: 194, 14.9, and 7.0; for β2a: 183, 11.6, and 5.2; for β3: 40, 40.2, and 28.1; and for β4: 171, 16.9, and 7.0.

