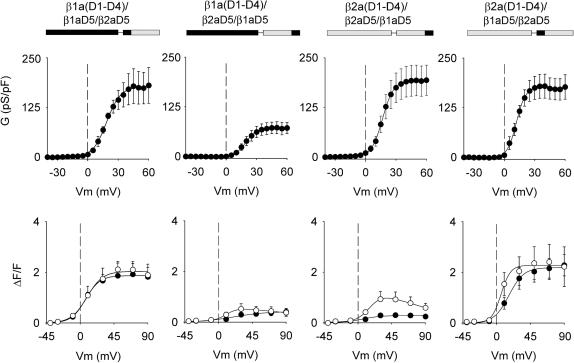
FIGURE 5.
Ca2+ conductance and Ca2+ transients expressed by β1a-β2a chimeras with domain D5 in different positions. Columns show the functional behavior chimeras with a C-terminus corresponding to a tandem of β1aD5 and β2aD5 domains expressed in β1 KO myotube. Ca2+ conductance curves were fit with Eq. 1 with the following parameters (Gmax in pS/pF, V1/2 in mV, and k in mV, respectively). For β2a(D1–D4)/β2aD5/β1aD5: 192, 16.7, and 5.5; for β2a(D1–D4)/β1aD5/β2aD5: 175, 11.9, and 4.4; for β1a(D1–D4)/β2aD5/β1aD5: 71, 19.4, and 5.3; and for β1a(D1–D4)/β1D5/β2aD5: 177, 18.5, and 6.8. For fluorescence curves, open symbols correspond to peak ΔF/F obtained with a 200-ms depolarization, and solid symbols were obtained with a 50-ms depolarization. The lines correspond to fit of the mean peak ΔF/F. All fluorescence versus voltage curves were fit with Eq. 1 except those obtained with the 200 ms depolarization in myotubes expressing β1a(D1–D4)/β2aD5/β1aD5 and β2a(D1–D4)/β2aD5/β1aD5, which were fit with Eq. 2. Curves were fit with the following parameters (ΔF/Fmax in ΔF/F units, V1/2 in mV, and k in mV, respectively). For β1a(D1–D4)/β1aD5/β2aD5:1.9, 7.0, and 9.4 (50 ms), and 2.0, 8.9, and 10.5 (200 ms). For β1a(D1–D4)/β2aD5/β1aD5: 0.4, 20.3, and 21.4 (50 ms), and 0.5, 11.1, and 7.8 (200 ms). For β2a(D1–D4)/β2aD5/β1aD5: 0.3, 4.9, and 12.5 (50ms), and 0.9, 16.9, and 9.5 (200 ms). For β2a(D1–D4)/β1aD5/β2aD5: 2.2, 16.3, and 9.9 (50 ms), and 2.3, 5.8, and 6.3 (200 ms).

