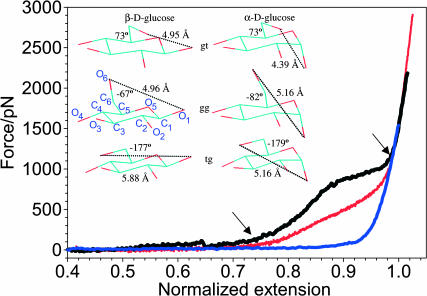
FIGURE 1.
A comparison of normalized force-extension relationships for methylcellulose (blue trace), pustulan (red trace), and dextran (black trace) measured by AFM. The normalization procedure assumed that the extension of the three polysaccharides at the maximum force for the cellulose trace (1538 pN) was equal to 1. The arrows indicate the points on the force spectrogram where the dextran trace separates from the pustulan trace and where both traces join again. They mark the extra extension of both polymers, beyond the extension expected for a simple FJC-like polymer. (Inset) Ab initio optimized rotamers (gt, gg, and tg) of β-D- and α-D-glucose using the B3LYP/6-311++G** method. The O6–O1 distance is shown together with the ω-torsion for all the rotamers. The second ring in the left panel shows the numbering of carbon and oxygen atoms in the glucopyranose ring used to define torsions ω, t1, and t2 (see text).

