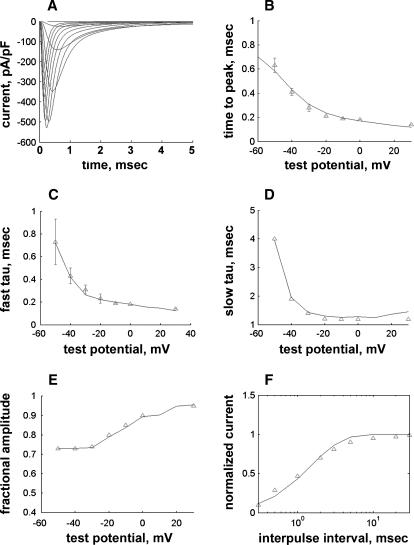
FIGURE 1.
Comparison of simulated (solid line) versus experimentally measured properties, from Nagatomo et al. (1998) and Wang et al. (2000), of INa (▵) at 33°C. (A) Model voltage-clamp current responses compared with experimental data (▵) over the range −50 mV to +30 mV. Activation and inactivation kinetics were studied using a voltage-clamp protocol with a holding potential of -150 mV and steps of 24-mS duration to various depolarizing potentials at 33°C. (B) Comparison of time to peak current (ordinate, ms) as a function of test potential (abscissa, mV) for model versus experiments; see Fig 3, B–E, in Nagatomo et al. (1998). (C) The decay phase of the current traces at potentials from −50 mV to +30 mV was fit with a sum of two weighted exponentials. C shows the fast time constant of inactivation (ordinate, ms) plotted against test potential (abscissa, mV). (D) Slow time constant of inactivation (ordinate, ms) plotted against test potential (abscissa, mV) from fitting procedure described in C. (E) Fractional amplitude of the fast component of inactivation (ordinate) plotted against test potential (abscissa, mV) from fitting procedure described in C. (F) Time course of recovery from inactivation expressed as fraction of maximum current (ordinate) versus recovery interval (abscissa, ms). Data obtained using a two-pulse protocol with a variable interpulse recovery interval (abscissa). Current in second pulse was normalized to current in first pulse and plotted as the ordinate. Experimental data provided for comparison from Fig. 4 in Wang et al. (2000).

