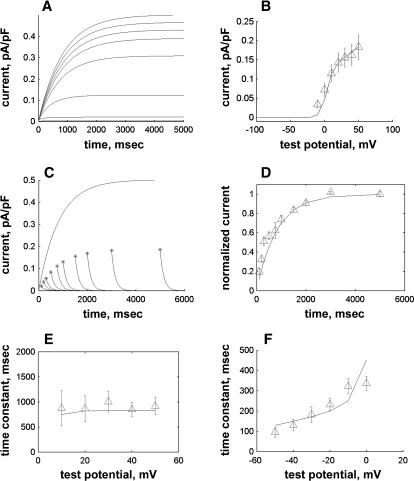
FIGURE 2.
Comparison of simulated versus measured (Virág et al., 2001) IKs properties. (A) Simulated IKs in response to voltage-clamp steps from a holding potential of −40 mV to potentials from −10 mV to 50 mV. (B) Tail current magnitudes at −40 mV (ordinate, pA/pF) were computed after depolarization to test potentials (abscissa, mV) from −10 mV to 50 mV for 5000 ms. Experimental tail current magnitudes provided for comparison; from Fig. 2 C, in Virág et al. (2001). (C) Envelope of tails protocol. Voltage-clamp step to +50 mV of varying duration was followed by return to holding potential. Resultant tail currents (ordinate, pA/pF) plotted versus duration of voltage-clamp step (abscissa, ms), overlaid on step current. Peak tail currents are denoted by asterisks. (D) Normalized peak tail currents from protocol in C (ordinate), plotted versus voltage clamp duration (abscissa, ms), highlighting time course of activation of tail currents. Both model and experiment show a slowly activating outward current without evidence of inactivation at +50 mV. Experimental data from Fig. 3 in Virág et al. (2001). (E) Time constant of activation calculated from protocol in D (ordinate, ms), computed for step potentials from +10 to +50 mV (abscissa, mV). Data from Fig. 4 in Virág et al. (2001). (F) Kinetics of deactivation. Tail currents were elicited at potentials between −50 mV and 0 mV and the decay phase was fit with a single exponential. Deactivation time constants (ordinate, ms) were calculated and compared with experimental findings as a function of step potential (abscissa, mV). Experimental data from Fig. 4 in Virág et al. (2001).

