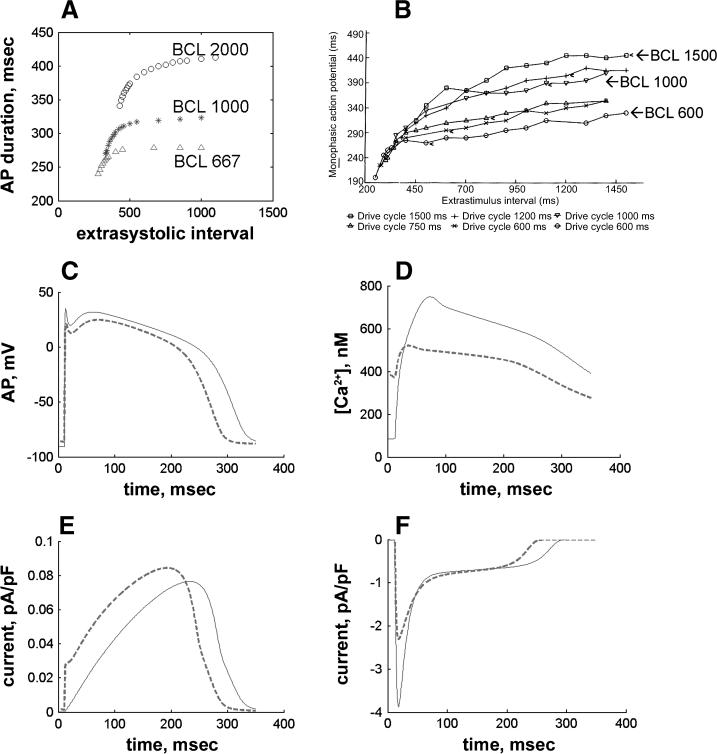
FIGURE 6.
Static restitution protocol. (A) APD (ordinate, ms) as a function of S1-S2 diastolic interval (abscissa, ms) at three different priming frequencies. (B) Experimental restitution curves recorded by Morgan et al. (1992). (C) APs in response to S1 (solid line) and S2 (dashed line). S1-S2 interval for C-E set at 350 ms, BCL 1000 ms. (D) Intracellular Ca2+ transients (ordinate, nM) during the S1 AP (solid line) and the S2 premature AP (dashed line). (E) IKs (ordinate, pA/pF) during the S1 (solid line) and the S2 APs (dashed line). (F) ICaL (ordinate, pA/pF) during the S1 (solid line) and S2 APs (dashed line).

