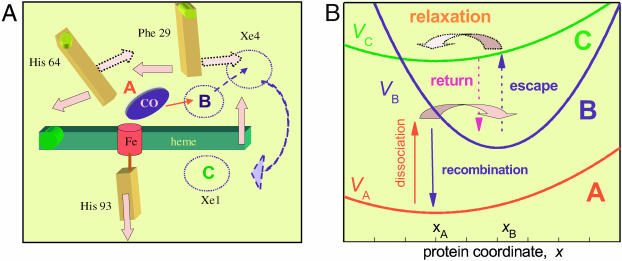
FIGURE 1.
The coupling of ligand binding and migration to conformational change in Mb. (A) Schematics of some heme and distal pocket motions as observed in the recent time-resolved crystallographic study of Schotte et al. (2003). Full arrows represent motions immediately after photolysis, whereas the dotted arrows are motions occurring later, after CO expulsion from the heme pocket. (B) Schematics of the corresponding multi-tier diffusion model. Effective potentials for tiers A, B, and C are the three parabolas. Vertical arrows symbolize the coordinate-dependent rate functions. Fat horizontal arrows depict the downhill protein relaxation in these two tiers. They correspond to the early and late relaxation phases depicted in A.

