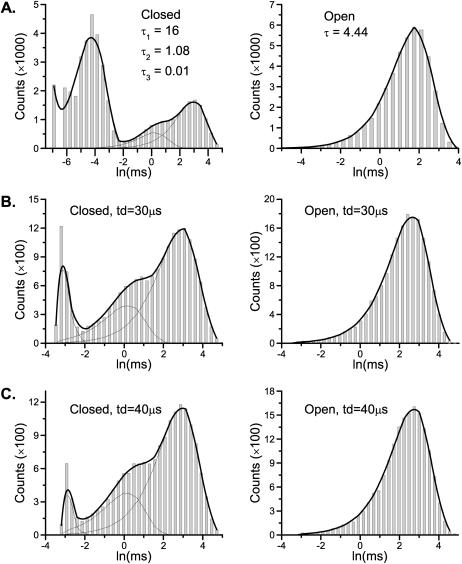
FIGURE 1.
Histogram analysis of a linear sequential model. The one-dimensional histogram fitting sufficed to resolve the model (A), but it is less sustainable to missed events (B) than the two-dimensional histogram fitting (C). The imposition of a dead time had the most profound effect on the short closures (the leftmost peak in the solid histograms). The openings remained a single exponential, but the mean time increased. Data were simulated from the nicotinic ACh receptor ion channel in Scheme I. The solid lines show the overall distributions predicted from the estimated models, and the dotted lines represent the individual components.

