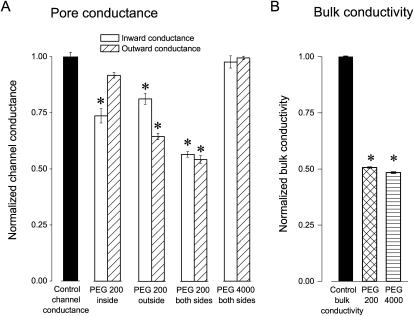
FIGURE 5.
Effects of PEG 200 and PEG 4000 on unitary maxi-anion channel conductances and bulk solution conductivities. (A) Pore conductance changes by addition of PEG 200 and PEG 4000 from the inside, outside, and both sides of membrane patches. Open bars represent the inward conductance, and hatched bars the outward conductance. Asterisk symbol means significantly different from the control at p < 0.05. (B) Changes in bulk conductivity by addition of PEG 200 and PEG 4000. The electrical conductivity of control Ringer solution (control) was 15.24 ± 0.03 mS/cm (n = 5). Asterisk symbol means significantly different from the control at p < 0.05.

