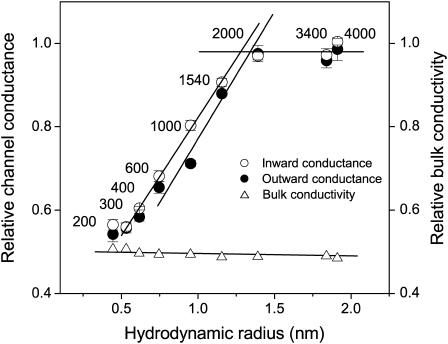
FIGURE 7.
Relative changes in unitary maxi-anion single-channel conductances as a function of the hydrodynamic radii (R) of nonelectrolyte polymer molecules applied from both sides of membrane patches. The ascending straight line for channel inward conductances (open circles) is a linear fit to the data points for PEG 300–PEG 1540 and crosses the plateau level at R = 1.28 nm. The ascending straight line for outward conductances (solid circles) is a linear fit to the data points for PEG 600–PEG 2000 and crosses the plateau level at R = 1.34 nm. Relative decreases in the bulk conductivity of the polymer-containing control Ringer solutions used in these experiments (open triangles) are also plotted. Mean single-channel amplitudes at different voltages (n = 5–20 from at least five different patches) were used to construct I–V relationships and calculate slope conductances. Error bars represent standard errors of the linear fits.

