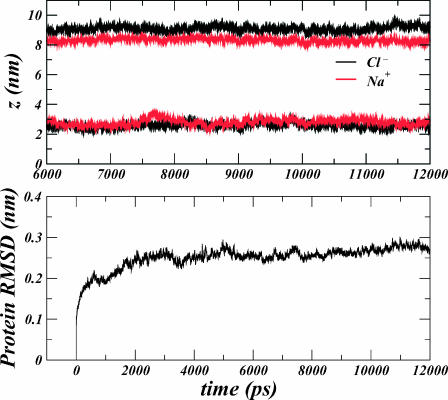
FIGURE 1.
(Top panel) Time series showing the evolution of the centers of mass for each type of ion in our system for the extracellular (z > 6 nm) and intracellular (z < 6 nm) side of the membrane. Stability in the evolution indicates a converged equilibrium ion distribution for the last 6 ns of the simulation. (Bottom panel) Time series showing the RMSD obtained after performing an optimal least-squares alignment of all protein configurations in the trajectory to the initial protein structure.

