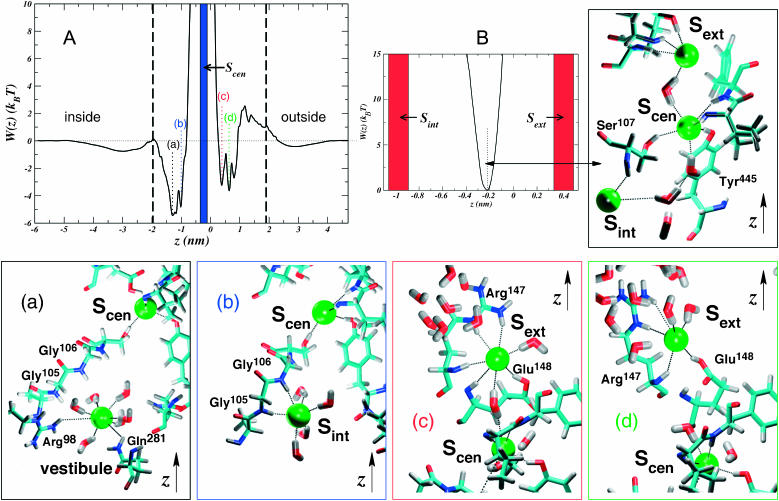
FIGURE 3.
Conditional PMF profiles for Cl− inside the protonated ClC transporter. The z axis is chosen in the same manner as in Fig. 1. The black dashed lines delimit the pore boundaries. (A) Profiles for bringing Cl− from bulk to Sint (to the left of the occupied Scen site marked with a blue stripe at  ) and to Sext (to the right of Scen). Because both profiles are given with respect to the bulk electrolyte, we can draw them on the same plot and compare them. The panels a–d are color coded with the features marked on the plot, and show the structural events correlated with minima in the free-energy profiles. Ions are shown as green spheres, and hydrogen bonds are shown as black dotted lines. (B) PMF of Cl− between the occupied Sext and Sint sites (Scen is marked by the dotted line), and the structure (right panel) of Scen.

