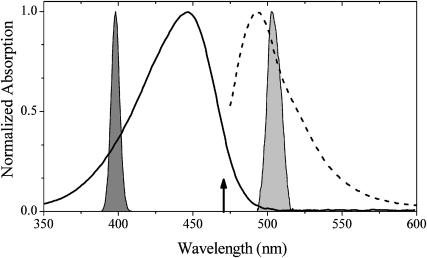
FIGURE 1.
Normalized static absorption (solid line) and fluorescence (dashed line) spectra of PYP overlapping the spectra of the 395-nm pump (shaded) and the 505-nm dump (light shaded) laser pulses. The arrow at 470 nm indicates the wavelength used for red-edge excitation of the sample in the excitation-wavelength-dependent experiment.

