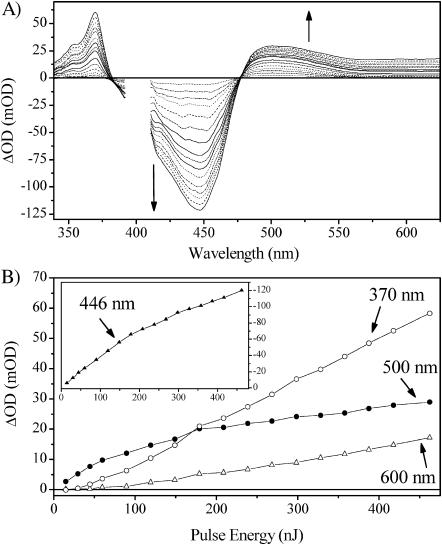
FIGURE 6.
Power dependence of the PP data with 395-nm excitation. (A) Power dependence of the 200-ps PP spectrum. The region around the pump excitation wavelength is corrupted due to scatter from the pump pulse. The arrows indicates the direction of the signal change with increasing laser power. (B) Power dependence of representative wavelengths (as labeled). (Inset) (Negative) dependence of the bleach because of its greater range.

