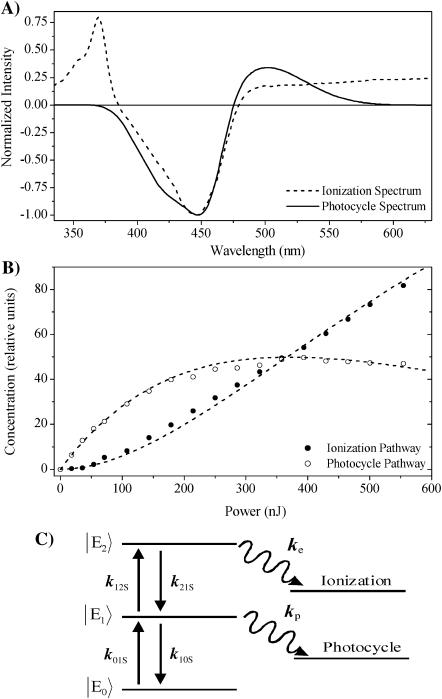
FIGURE 7.
Analysis of the power-dependent PP spectra at 200 ps. (A) Estimated spectra associated with the photocycle (solid curve) and ionization (dashed curve) pathways. (B) Power-dependent concentration of the two pathways overlapping the predicted curves for the proposed model in the inset. (C) Abridged multistate photocycle model to explain observed power dependence. Fitting parameters: {k01S, k10S}= 44,000 cm2/mmol and {k12S, k21S}= 45,000 cm2/mmol. The used ke = 1/100 fs and kp = 1/2 ps time constants are relatively insensitive in modeling a single PP spectrum and are mean values from the full analysis shown in Table 1.

