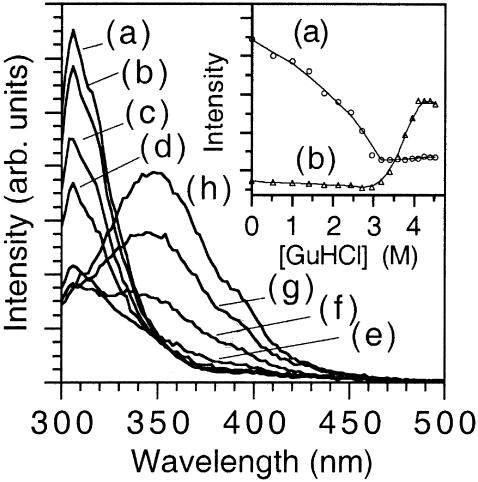
FIGURE 1.
Fluorescence spectra of azurin free in solution obtained during the chemical denaturation adding GuHCl. The curves correspond to the following molar concentrations of denaturant: (a) 0, (b) 1.42, (c) 2.43, (d) 3.20, (e) 3.60, (f) 3.78, (g) 3.95, and (h) 4.5 M. Several other curves were not presented for clarity. The inset shows denaturation plots for azurin in solution following the (a) 308 nm band and (b) 348 nm bands.

