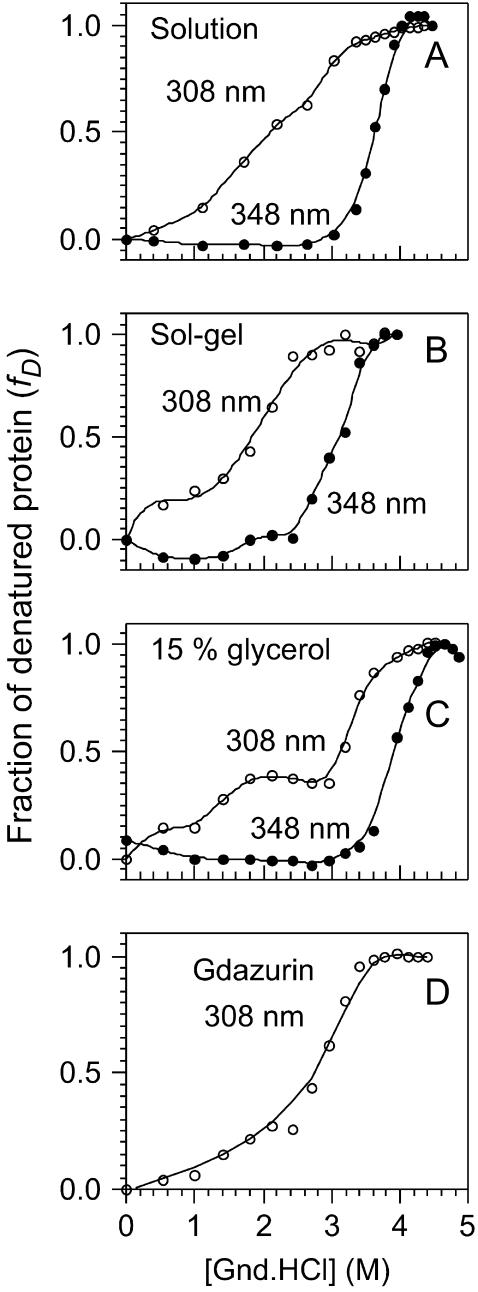
FIGURE 2.
Denaturation of azurin adding GuHCl monitoring the relative fluorescence yield of tryptophan: (A) the curve of azurin free in solution monitored at 308 different probes the N ↔ I (○), whereas the curve at 348 nm probes the I ↔ D; (B) denaturation of azurin immobilized in a sol-gel monolith followed at 308 and 348 nm. The denaturation followed at 348 nm occurs at lower [GuHCl] than free in solution indicating a decrease in the stability of protein; (C) in the presence of glycerol the curve at 348 nm shows an increase in the stability of the macromolecule, whereas the curve at 308 nm shows a plateau, indicating the presence of an intermediate conformation; and (D) denaturation curve for gadolinium azurin followed at 308 nm.

